Differential dynamics of periphyton and phytoplankton communities along a eutrophication gradient in the shallow Cohana Bay of Titicaca Minor Lake (Bolivia).
William G. Lanza Aguilar1, Viviana Cruz Hernández1, Darío Achá Cordero1 & Xavier Lazzaro2
1Institute of Ecology (IE), Universidad Mayor de San Andrés (UMSA), La Paz, Bolivia, Campus de Cota Cota, Calle 26 s/n, La Paz, Bolivia,2Biology of Aquatic Organisms and Ecosystems (BOREA), Institute of Research for Development (IRD), Paris, France.
Pilot Project UNDP/GEF 05-B-05 'Permanent Titicaca Observatory'
Objectives - Microscopic algae (microalgae) are photosynthetic organisms (microscopic plants) that inhabit aquatic ecosystems, such as Lake Titicaca, and are bioindicators of water quality. In many countries, particularly in Europe, they are used as monitoring tools.
There are mainly two communities of microalgae in aquatic ecosystems, phytoplankton and periphyton (or biofilm). However, these communities can be differentiated by the habitat in which they are found. Phytoplankton floats in the water and can be carried
by the current. Periphyton, grows attached to any type of water-bearing surface such as rocks, plants, sediment, etc. Here, we study the periphyton that grows on the stems of totora.
We intend to answer the following research questions:
1. Do phytoplankton and periphyton share a similar microalgal composition or are they very different?
2. Are both communities sensitive to eutrophication?
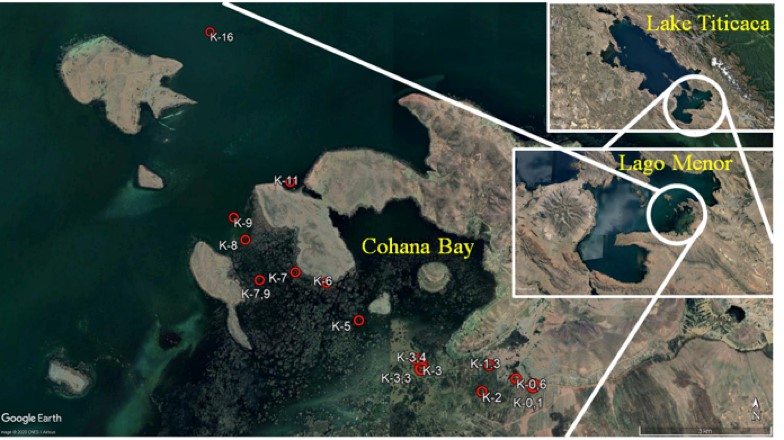
Study strategy - Along a eutrophication gradient in Cohana Bay, between the mouth of the Katari River and the outlet to Paco Island (Suriqui), we studied the evolution of the composition and abundance of phytoplankton and periphyton microalgae at about 14 stations, during sampling campaigns in the dry season, between April and October 2019 (n = 20; see map in Fig. 1).

Fig.1 - Location of the 14 sampling stations along the eutrophication gradient in Cohana Bay, between the mouth of the Katari River (K0.1), as the source of pollution to the east, and the outlet in front of Paco Island (Suriqui, K16) to the west; that is, between 0.1 and 16 km from the source.

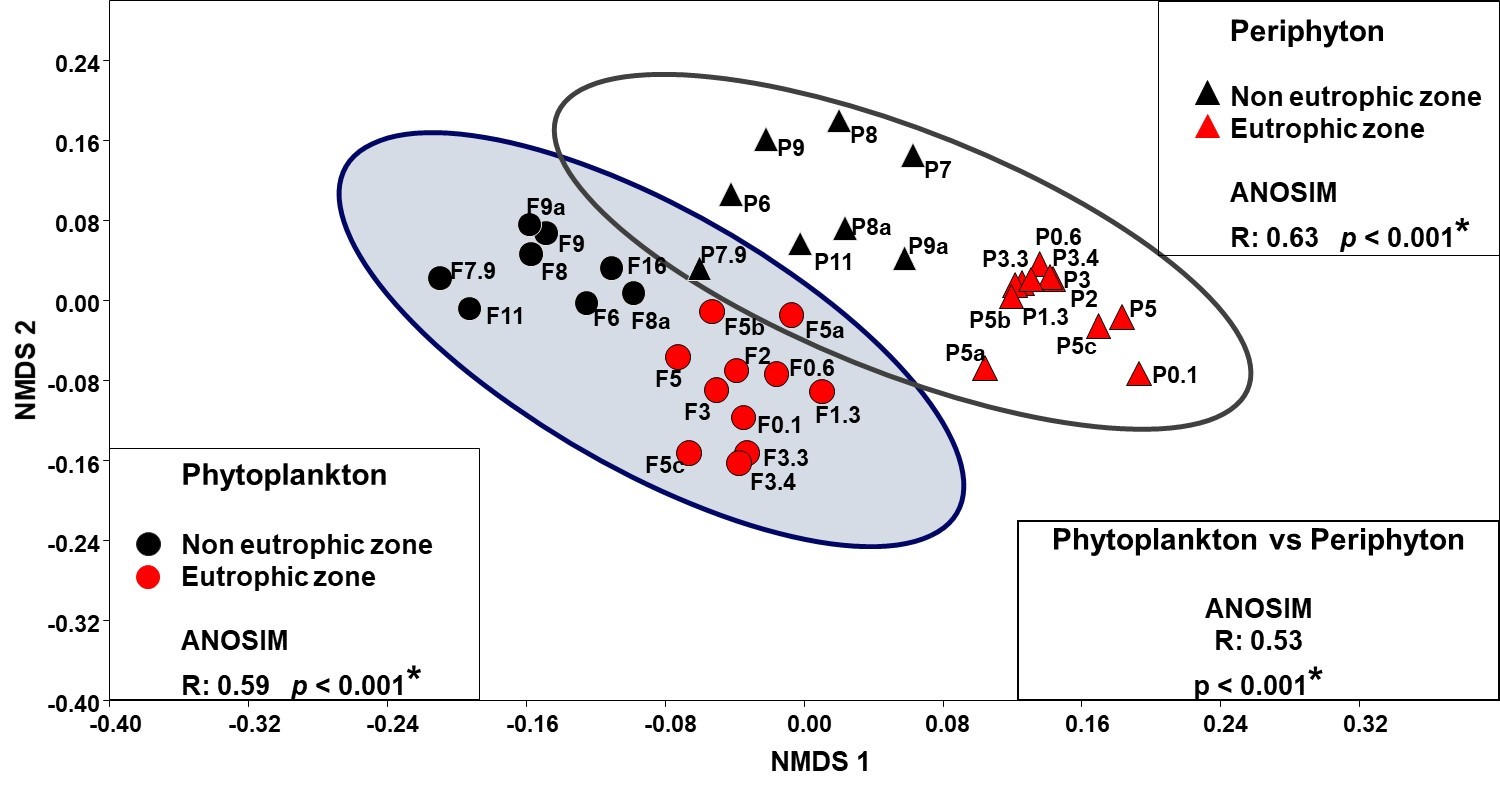
Figure 1 - Non-metric Multidimensional Scaling Analysis (NMDS) based on a similarity matrix (ANOSIM-Bray curtis) between phytoplankton samples and periphyton in the eutrophication gradient. Round symbols represent phytoplankton samples and triangular symbols represent periphyton. The red stations belong to the eutrophic zone and the black stations to the non-eutrophic zone. The code for each sample identifies the corresponding community type, where "P" represents periphyton and "F" represents phytoplankton. The number in the code denotes the distance (in km) from the mouth of the Katari river.
Non-Metric Multidimensional Scaling Analysis (NMDS) - This analysis is a statistical technique that ranks samples (sampling stations) based on the similarity of composition that exists between samples. A
close proximity between stations indicates that there is a higher similarity between samples. Conversely, if the stations are far apart, the composition is very different.
Figure 1 shows two clusters (circled), one corresponding to phytoplankton (round symbols) and the other corresponding to periphyton (triangles) suggesting that the composition between the two communities is different (ANOSIM.
R: 0.53, p value
<0.001).
The red symbols are those samples collected in the eutrophic zone (see distance in relation to the mouth of the Katari river) and the black symbols are those samples collected in the non-eutrophic zone (see distance in relation
to the mouth of the Katari river) and the black symbols are those samples collected in the non-eutrophic zone (see distance in relation to the mouth of the Katari river). We can observe that for both periphyton and phytoplankton,
the compositions between the eutrophic and non-eutrophic zones are different, suggesting that both communities are sensitive to eutrophication in Cohana Bay.
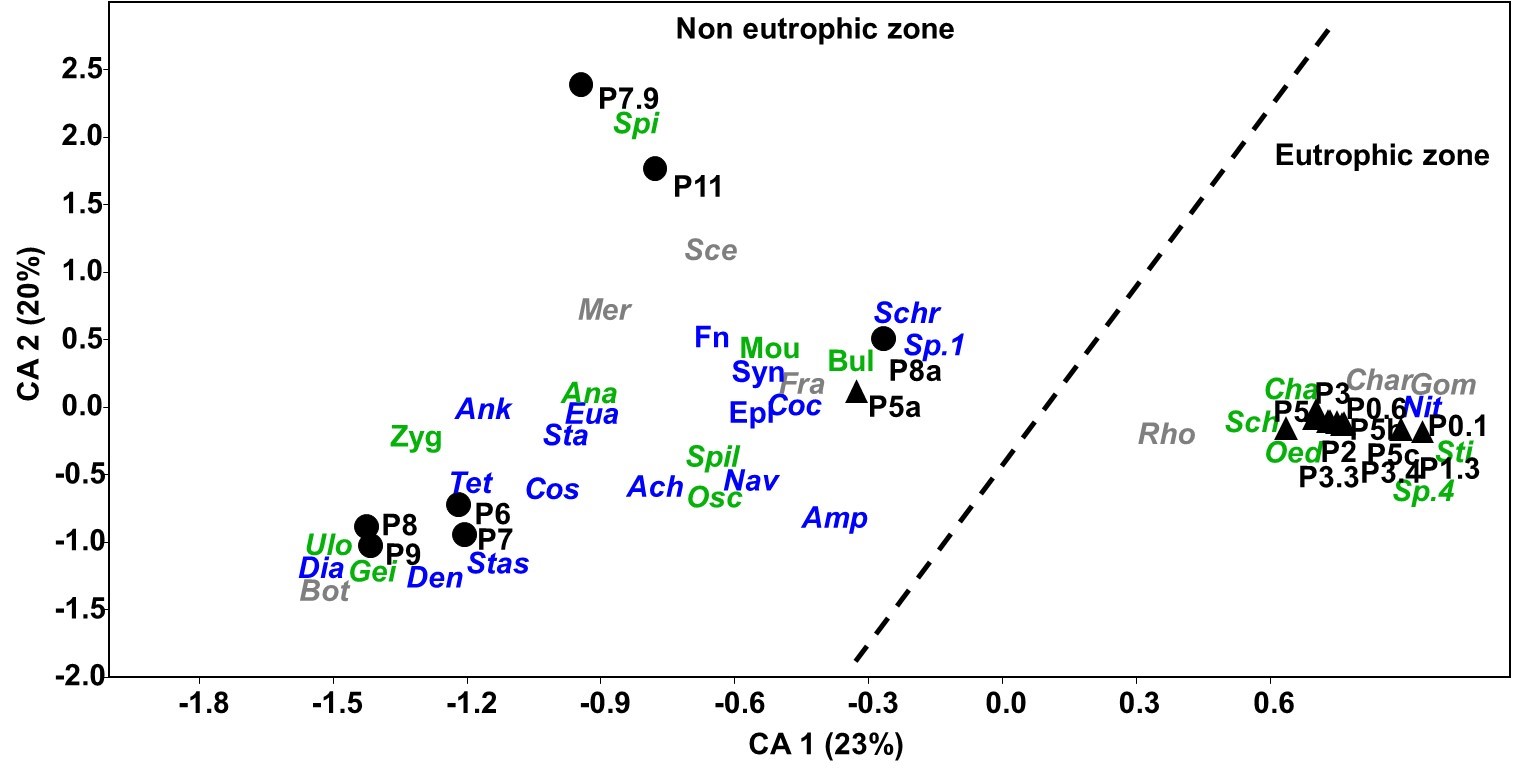
Correspondence analysis (CA) - This analysis is a technique that orders the samples and genera based on a matrix of distances (Chi-square), grouping the stations that present a similar composition at the genus level, in that the location of the genera (abbreviated) responds to their dominance, i.e. when a genus is found near a particular station, it indicates that this genus is dominant.

Figure 2 - Correspondence analysis of the periphyton community. Abbreviations in italics indicate the genera present (see abbreviations in Table 1). The color of the genera indicates the life form, where green corresponds to filamentous forms, blue to unicellular forms and gray to colonial forms...
Figure 2 shows the change in periphyton composition between the eutrophic zone and the non-eutrophic zone. It can be seen that the eutrophic zone presents a very homogeneous composition (grouped), where there is a dominance of certain opportunistic genera, particularly filamentous life forms (green genera), such as Oedogonium (Oedo) (10 to 80% abundance) and colonial forms, such as the genera Gomphonema (Gom) (13 to 67%) and Characium (Char) (16 to 59%). In the non-eutrophic zone, the composition is more heterogeneous, suggesting a greater diversity of genera and life forms, without a clear dominance of any one genus.
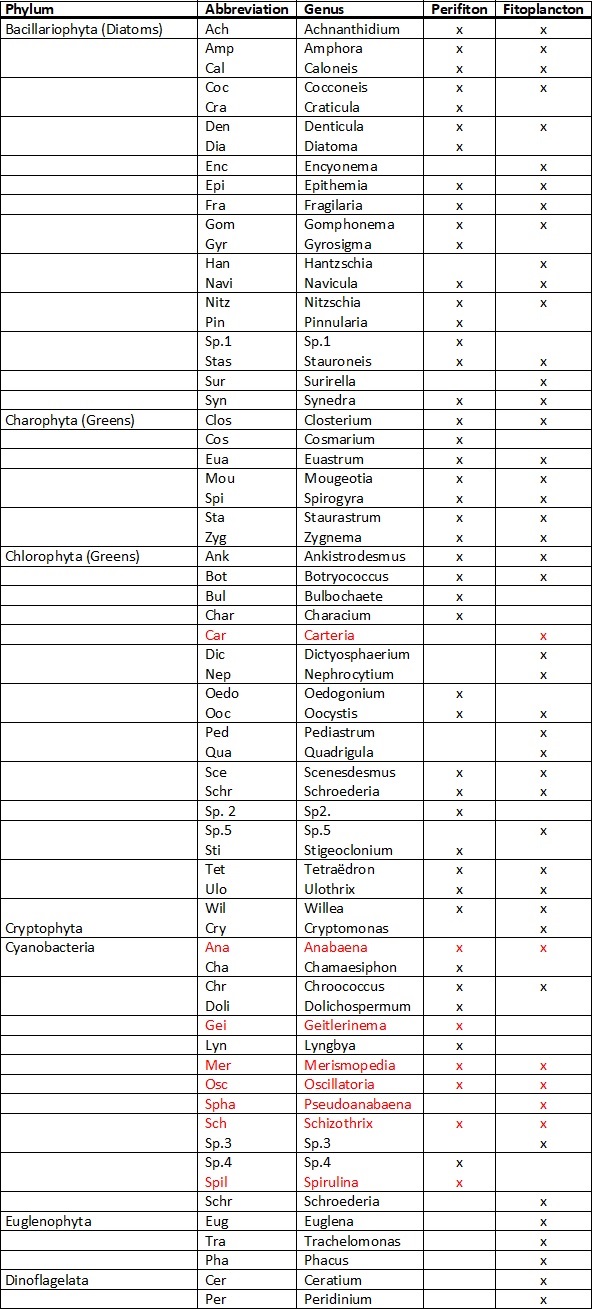
Table 1 - Composition of microalgal communities between periphyton and phytoplankton.
